
Social Media Marketing Tips for Small Business Growth
Unlock your business’s potential with proven social media marketing tips. Boost visibility, attract customers, and thrive without a big budget!


TL;DR:
- Website speed depends on understanding underlying systems, with server response time being the most critical factor. Improving front-end optimizations without addressing backend bottlenecks often results in negligible or temporary gains, risking site stability and rankings. Ongoing monitoring, coordinated infrastructure, and prioritized fixes are essential for sustainable, measurable performance improvements.
Slow websites don’t just frustrate visitors. They cost you rankings, leads, and revenue. If you’ve been searching for how to improve site speed and landing on the same recycled advice about compressing images and enabling caching, you’ve probably noticed something: the results rarely stick. That’s because site speed is not a checklist. It’s a system, and most of the work happens underneath the surface where a quick plugin install can’t reach. This article exposes the real layers of complexity behind speed optimization so you can make smarter decisions about how your site gets managed.
| Point | Details |
|---|---|
| Core Web Vitals set the standard | LCP, CLS, and INP have specific thresholds that Google uses to evaluate your site’s speed and user experience. |
| Server response time is the gating factor | No front-end fix will work properly if your server is slow to respond. Backend improvements come first. |
| Real user data beats lab scores | Synthetic tools like Lighthouse give you a snapshot; field data tells you what actual visitors experience. |
| DIY optimization carries serious risk | Uncoordinated tweaks cause render-blocking, layout shifts, and broken pages that hurt more than they help. |
| Speed must be actively maintained | Performance degrades over time without continuous monitoring, audits, and coordinated deployment. |
Before you fix anything, you need to know what you’re fixing. Google evaluates site speed through Core Web Vitals, a set of metrics with specific performance thresholds tied directly to search rankings. There are three primary signals to understand.
Largest Contentful Paint (LCP) measures how long it takes for the main content of a page to load. A score under 2.5 seconds is “Good.” Above 4 seconds and Google considers your page slow. Cumulative Layout Shift (CLS) tracks visual stability. A score under 0.1 means your page isn’t jumping around as it loads. Interaction to Next Paint (INP) replaced First Input Delay in 2024 and measures responsiveness. Under 200 milliseconds is the target.
Here is why this matters strategically:
Pro Tip: Use field data at the 75th percentile as your primary input for prioritizing fixes. That number reflects your worst-performing segment, not your average visitor.
One critical distinction: lab tests like Lighthouse give you a controlled snapshot under ideal conditions. They are useful for diagnosis but cannot replace real user monitoring. A site can score 90 on Lighthouse and still deliver a poor experience on a 4G mobile device in a rural area. That gap is where most DIY speed projects fall apart.
| Metric | Good Threshold | Poor Threshold | Primary Cause of Failure |
|---|---|---|---|
| LCP | Under 2.5s | Over 4s | Large images, render-blocking resources |
| CLS | Under 0.1 | Over 0.25 | Unstable fonts, unresized images |
| INP | Under 200ms | Over 500ms | Heavy JavaScript, long tasks |
Here’s where the frustration sets in. You run PageSpeed Insights, it tells you to “eliminate render-blocking resources” or “defer offscreen images,” and you try to follow the advice. Then something breaks. Or the score improves but the site actually feels slower in real use. This is not bad luck. It is the natural outcome of treating a complex system like a simple checklist.
LCP problems often originate from render-blocking resources and large images. But fixing those requires understanding why those resources exist in your loading sequence, not just removing or deferring them blindly.
A few of the most underappreciated traps:
And then there is the backend. Server response time gates everything. No amount of front-end work will compensate for a hosting environment with a slow Time to First Byte (TTFB). HTML has to fully download before any other resource can start loading. If your server takes 800 milliseconds to respond, every subsequent improvement is fighting uphill.
Pro Tip: Before spending time on front-end optimizations, check your TTFB using a tool that shows request waterfalls. A slow TTFB almost always points to a hosting or caching problem, not a code problem.

The painful truth about DIY speed work is that front-end micro-optimizations yield diminishing returns when the backend is weak. You can spend days shaving milliseconds from your CSS delivery while your server adds 600 milliseconds before any of that work even matters.
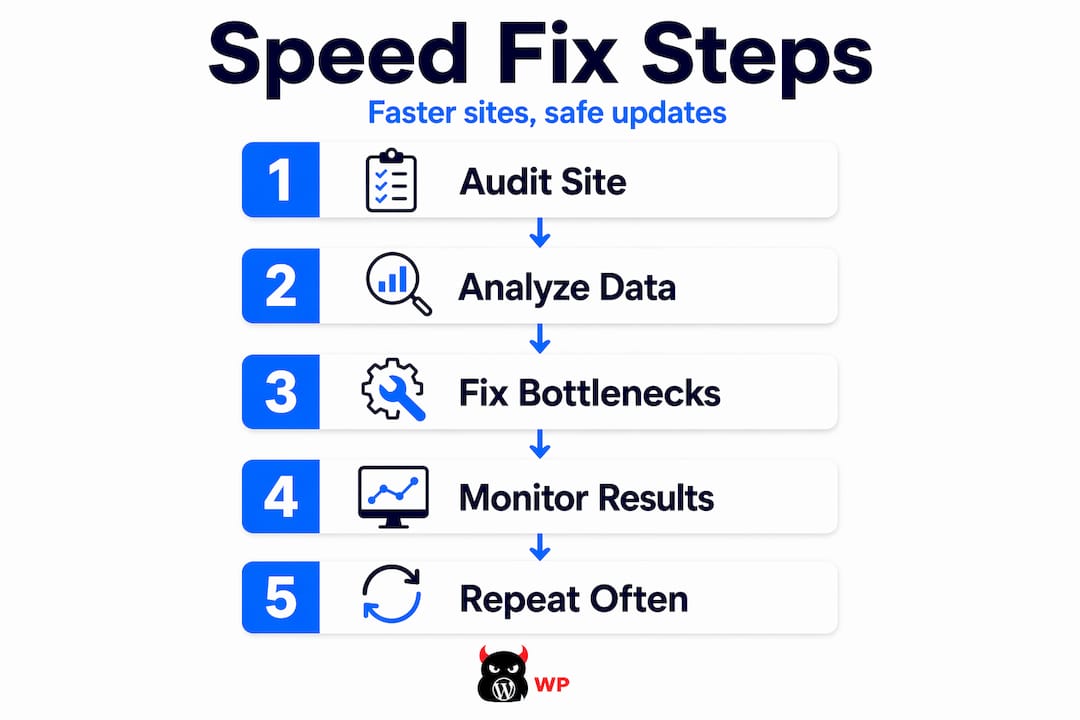
Effective speed optimization is less about random tweaks and more about understanding loading mechanics and prioritizing high-impact changes in the right order. That order matters more than most people realize.
Here is a strategic sequence that holds up across site types and traffic levels:
Pro Tip: Analyze request waterfalls rather than chasing individual recommendations. Understanding why your LCP resource is discovered late tells you far more than any score number does.
One comparison worth understanding clearly:
| Approach | Short-Term Result | Long-Term Outcome |
|---|---|---|
| Random plugin-based tweaks | Score fluctuates | Degradation, broken features |
| Backend and hosting improvements | Immediate TTFB gains | Stable, scalable performance |
| Coordinated front-end optimization | Measurable metric gains | Sustained user experience improvement |
| Continuous monitoring and audits | Regressions caught early | Predictable, maintained speed |
The connection between website speed and business growth is well established. Faster sites convert better, rank higher, and retain visitors longer. The strategic question is not whether to invest in speed. It is whether to manage that investment properly.
Most site speed projects fail not because the fixes were wrong, but because they were applied without a full picture of the system they were changing.
“The operational cost of unmanaged DIY speed projects is not just time. It’s the compounding risk of broken pages, ranking drops, and visitor loss that accumulates every week the issues go unresolved.”
The brands that suffer most are those that treat speed optimization as a one-time project. They hire someone to run a speed audit, apply a batch of fixes, celebrate the improved score, then do nothing for twelve months. By then, new plugins have been added, images have gone unoptimized, and third-party scripts have multiplied. The score they were proud of is gone.
Getting your site fast is only half the job. Keeping it fast is the part that most DIY approaches completely ignore.
Pro Tip: Set your monitoring baseline immediately after a successful optimization round. Future regressions become instantly visible against that baseline, instead of being masked by gradual degradation.
Professional website management creates the infrastructure for this kind of ongoing vigilance. Without it, performance maintenance depends on whoever happens to notice a problem. That is not a system. That is hope.
I’ve worked with enough websites to know that the most dangerous phase of any speed project is right after the first audit. That’s when the scores are in view, the recommendations look manageable, and everything feels under control. It rarely stays that way.
What I’ve seen repeatedly is that the teams who treat speed as a technical checklist get stuck in a cycle. They apply fixes, something breaks, they roll back, they try again with a different plugin, and six months later the site is slower than when they started. The problem isn’t effort. It’s that speed optimization is an infrastructure discipline, not a task.
The most sustainable outcomes I’ve seen come from treating your server environment, your deployment process, and your monitoring setup as a single coordinated system. When one part changes, all three need to be in sync. That requires expertise and ongoing attention, the kind that doesn’t come from a YouTube tutorial or a one-time agency engagement.
DIY speed work also carries a risk that rarely gets discussed: you can make your site look faster in tests while making the actual user experience worse. Deferred scripts that break interactivity, lazy-loaded images that delay visible content, preloaded fonts that block critical rendering. These are all real outcomes of well-intentioned fixes applied without full context.
If you want to understand why faster websites rank higher and actually sustain those gains, the answer is not more plugins. It’s better infrastructure managed by people who do this every day.
— Vector
If this article has made one thing clear, it’s that site speed is a system problem. Patching it with isolated tweaks doesn’t hold. You need hosting that performs from day one, a front-end built with speed baked in, and ongoing management that catches regressions before they cost you rankings.

That is exactly what MonsterWP delivers. Every site we build starts with performance-optimized infrastructure, Elementor Pro, and an architecture designed around Core Web Vitals from the ground up. No bloated page builders. No uncoordinated plugin stacks. Just custom-built fast websites that stay fast because we manage them continuously. Starting at $299 per month, you get a fully managed digital engine without the operational chaos of DIY. If your site speed is a problem, we make it our problem.
An LCP under 2.5 seconds is considered “Good” by Google and directly supports stronger search rankings. Anything above 4 seconds is classified as “Poor” and will negatively affect your visibility.
Lighthouse runs in a controlled lab environment that doesn’t account for real-world factors like network conditions, device performance, or third-party scripts. Field data from real users is the authoritative source for understanding actual visitor experience.
Yes. Applying lazy-loading to your LCP image delays the most important visible content on the page and worsens your LCP score. LCP images should load early with high fetch priority, not be deferred.
At minimum, audit before every major deployment and after any significant content or plugin change. Continuous monitoring with regression alerts is the only reliable way to catch performance drops before they affect rankings.
No resources can load until the initial HTML is downloaded from the server. A slow server response time creates a delay that every subsequent optimization has to overcome. Fixing TTFB is the highest-leverage move in any speed improvement effort.
Unlock your business’s potential with proven social media marketing tips. Boost visibility, attract customers, and thrive without a big budget!

Discover what is website analytics and how it drives real business insights. Transform your data into actionable strategies today!