
Social Media Marketing Tips for Small Business Growth
Unlock your business’s potential with proven social media marketing tips. Boost visibility, attract customers, and thrive without a big budget!

TL;DR:
- Most business owners misinterpret website analytics as simple traffic counts, missing its true purpose.
- Effective analytics requires proper setup, ongoing validation, and interpretation to inform genuine business decisions.
Most business owners glance at their website traffic numbers, see a big green arrow pointing up, and feel good about it. That feeling is a trap. Understanding what is website analytics at a surface level gives you the illusion of insight without any of the actual intelligence. Real website analytics tells you who visited, what they did, why they left, and whether any of it moved your business forward. It answers questions your gut instinct never could. This guide cuts through the noise and shows you what analytics actually involves, what it takes to get it right, and why getting it wrong is more costly than most people realize.
| Point | Details |
|---|---|
| Analytics is more than traffic counts | Website analytics measures visitor behavior, events, and conversions to inform real business decisions. |
| Setup complexity is real | Misconfigured tags silently break data collection, making even expensive tools unreliable. |
| Raw metrics need context | Numbers without qualitative insight lead to wrong conclusions and wasted marketing spend. |
| Measurement planning comes first | Defining what matters before collecting data separates useful dashboards from confusing noise. |
| Managed infrastructure removes chaos | Professional analytics management protects data accuracy and lets you focus on growth. |
Website analytics is the process of collecting, measuring, and analyzing website data to understand visitor behavior and improve user experience. But that definition, as clean as it sounds, hides a lot of moving parts.
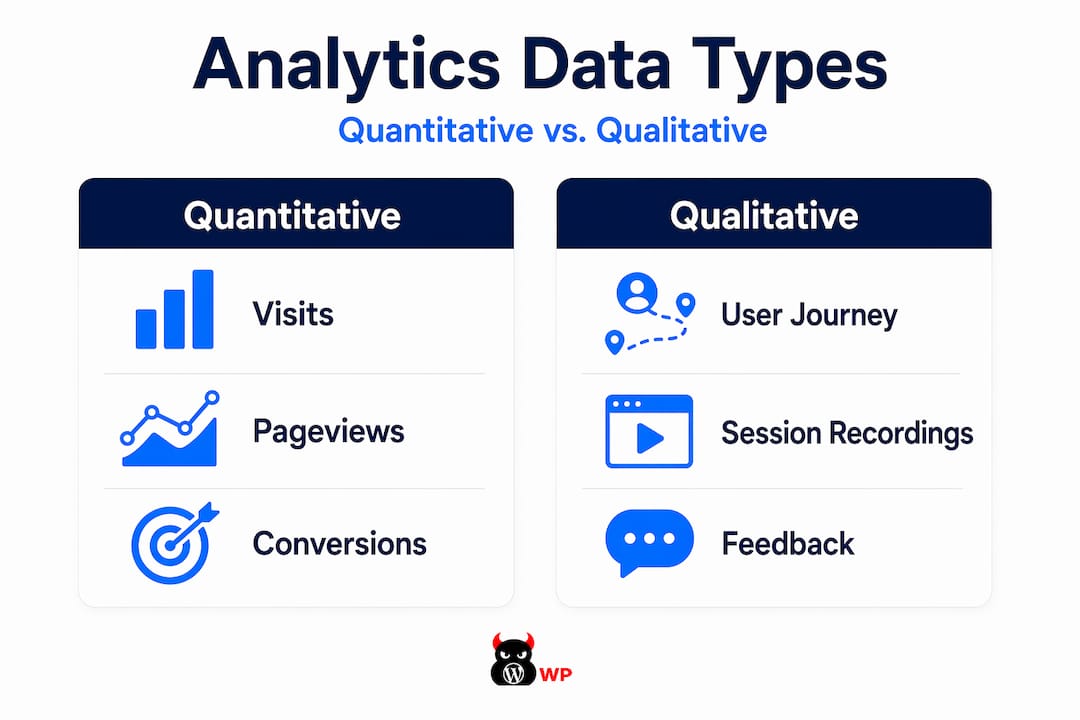
Analytics for websites pulls together two distinct types of data. Quantitative data tells you what happened: how many people visited, which pages they viewed, how long they stayed, and whether they completed a purchase or filled out a form. Qualitative data tells you why it happened, and that second layer is where most businesses go completely blind.
Here is a breakdown of the core data types and what they actually mean for your business:
| Data Type | What It Measures | Business Value |
|---|---|---|
| Pageviews | Total page loads in a period | Gauges content popularity and site traffic volume |
| Sessions | Individual site visits grouped by user | Reveals visit frequency and engagement depth |
| Bounce rate | Visitors who leave after one page | Flags weak landing pages or traffic mismatch |
| Conversions | Completed goals like form fills or purchases | Directly tied to revenue and lead generation |
| Traffic sources | Where visitors come from (search, social, paid) | Identifies which channels actually drive results |
| Events | Clicks, video plays, scroll depth | Shows granular interaction beyond page views |
The difference between businesses that grow with analytics and those that spin their wheels comes down to this: knowing which numbers connect directly to revenue. Pageviews feel good. Conversions pay the bills.
Web traffic analysis becomes genuinely useful only when insights reach decision-makers who can act on them. Data sitting in a dashboard that nobody interprets is just digital noise.
This is where the complexity really kicks in, and where most DIY setups quietly fall apart.
Website analytics tools work by embedding tracking code into your website’s pages. When a visitor lands on your site, that code fires and sends data back to your analytics platform. Sounds simple. The reality is several layers deeper.
Here is how data collection actually works in a modern analytics setup:
In Google Analytics 4, the fundamental unit is an event-based measurement model. Every interaction, from page loads to purchases, is recorded as an event. This is a significant shift from older analytics models and requires deliberate configuration to capture the events that matter to your business.
Correct setup is not optional. Google itself requires creating an account, configuring properties, setting data streams, and tagging your site before reliable data collection even begins. Each of those steps carries the potential for errors that won’t announce themselves.
Pro Tip: Misconfigured tags are the silent killers of analytics accuracy. If your event tags are placed before the core Google Tag snippet rather than after it, your data pipeline breaks without any error message. You will keep seeing data in your dashboard, but it will be incomplete, unreliable, or simply wrong.
Collecting data is step one. Turning it into decisions is the actual job, and this is the part most analytics guides skip entirely.
Modern analytics solutions unify data across channels and customer journeys rather than reporting isolated events. That unified view is what separates a business that understands its website performance from one that is just watching numbers fluctuate.
GA4 allows you to mark specific events as “key events” to prioritize them in reporting. This feature is underused and critically important. It means you stop staring at hundreds of data points and start focusing on the ones tied directly to business outcomes.
Here are the questions your analytics setup should be able to answer clearly:
But even a perfect answer to all those questions still leaves a gap. Website analytics combines quantitative data with behavioral and qualitative insights to understand not just what visitors do, but why they do it. Numbers alone cannot show you that a visitor was frustrated by a confusing form, or that they scrolled past your call-to-action because it blended into the background.
Pairing analytics with behavioral tools like heatmaps and session recordings closes the gap between what the data shows and what is actually happening in your visitor’s mind. One without the other leaves you making expensive guesses.
This is why serious website performance analysis treats quantitative and qualitative data as a team. Neither source is complete on its own.
Most business owners assume setting up analytics is a one-time task. Install a plugin, paste a tag, done. That assumption is where the trouble starts.
The actual risk profile of a DIY analytics setup looks like this:
| Risk Area | DIY Approach | Managed Approach |
|---|---|---|
| Tag configuration | High error rate, often undiscovered | Professional setup with validation |
| Data accuracy | Gaps and silent failures common | Monitored and audited regularly |
| Event tracking | Incomplete or misconfigured | Mapped to business goals from day one |
| Ongoing maintenance | Neglected after initial setup | Proactively maintained and updated |
| Decision-making risk | Decisions based on bad data | Reliable data powers confident decisions |
| Time cost | High and ongoing for non-experts | Absorbed by a dedicated team |
Incorrectly placed event tags cause data loss without any immediate notice. You will not get an alert. Your dashboard will still show activity. But the data feeding your marketing decisions will be corrupted, and you will not know until the damage is already done.
The financial cost is not just the time you spend troubleshooting. It is the campaigns you optimized based on false data, the pages you rebuilt because your metrics said they were underperforming when they actually weren’t, and the leads you lost because your funnel analysis pointed you in the wrong direction.
Pro Tip: When evaluating whether to manage analytics yourself or bring in professional support, ask one question: “Can I tell, right now, whether my event tracking is firing correctly on every page?” If the answer is no, or even “probably,” your data is already at risk. Proper analytics management includes ongoing validation, not just initial setup.
Understanding the data is one thing. Building a system that turns insights into consistent growth is another challenge entirely.
Analytics-driven decisions that connect directly to lead generation and revenue look very different from generic reporting reviews. Here is what a functioning analytics-driven growth system actually produces:
Web analytics requires a full process from measurement planning through accurate tagging to reporting and decision-making. Skipping the planning phase is the single most common mistake. When you start collecting data without defining what success looks like first, you end up with bloated dashboards full of numbers that cannot tell you anything useful.
The businesses that get the most from their analytics are not the ones with the most data. They are the ones with the clearest picture of what they are measuring and why. That clarity comes from professional infrastructure, not from adding another plugin and hoping for the best. A high-performance website built with proper analytics foundations turns your site from a digital brochure into a lead-generating machine that actually shows its work.

View analytics as an ongoing strategic asset. Your site changes, your audience evolves, and your business priorities shift. Your measurement framework needs to keep pace with all of that.
I’ve watched business owners spend thousands on ad campaigns and then make critical decisions based on analytics data that was broken from day one. Nobody told them. The dashboard still showed pretty graphs. The numbers kept climbing. But the data was measuring the wrong things, or missing events entirely, because the setup was rushed and never validated.
In my experience, the biggest misconception is that analytics is a tool you install. It is not. Effective analytics is a practice. It requires measurement planning before you collect a single data point, expert configuration to make sure what you collect is accurate, and ongoing interpretation to make sure it actually informs decisions.
I’ve seen businesses with enterprise-level analytics tools making worse decisions than companies using simpler setups, because the tool was never configured to match their actual business goals. The tool is not the advantage. The process behind it is.
My take is direct: if you are a growth-focused business owner and analytics is not a core part of how you operate your website, you are flying blind. And the cost of flying blind compounds every month you ignore it.
— Vector
If this article made you think, “This is more involved than I realized,” you are right. Website analytics is not a switch you flip. It is an infrastructure problem. And infrastructure problems are exactly what MonsterWP is built to solve.
Every website MonsterWP builds is configured for performance, speed, security, and accurate data collection from day one. No broken tags. No misconfigured events. No bloated retainers or confusing reports you have to decode yourself. Our custom WordPress websites come fully managed, with professional analytics setup built into the foundation. You get clear data, predictable pricing, and a team that keeps your digital engine running without chaos. If you are ready to stop guessing and start growing, explore what MonsterWP delivers.
Website analytics measures visitor behavior including pageviews, sessions, traffic sources, events, and conversions. It answers who visited your site, what they did, and whether they completed desired actions like purchasing or submitting a form.
Google Analytics 4 is the most widely used platform, tracking events and conversions across your site. Many businesses also pair it with behavioral tools like heatmaps and session recording software to understand visitor intent beyond raw numbers.
Misconfigured tags and incorrectly placed event scripts are the most common culprits. They silently break data collection without triggering any error alerts, meaning businesses often make decisions based on incomplete or corrupted data for months without realizing it.
A pageview counts every time a single page loads, while a session groups all the activity from one visit together. One visitor can generate dozens of pageviews in a single session, so confusing the two leads to inflated traffic assumptions.
Analytics identifies which traffic sources, pages, and content drive actual conversions rather than just traffic volume. That intelligence lets you reallocate budget, fix underperforming pages, and prioritize improvements that directly impact lead generation and revenue.
Unlock your business’s potential with proven social media marketing tips. Boost visibility, attract customers, and thrive without a big budget!

Explore the top 3 GoDaddy.com alternatives for reliable hosting solutions. Compare to make an informed decision for your business needs.